How much RAM does WordPress actually need?
On our live site the whole stack, Caddy, php-fpm and MariaDB, uses 262 MiB in docker stats (cache-adjusted), and the machine as a whole reports 753 MiB used in free -m. The other 491 MiB is, roughly, memory in use outside the containers (kernel, Ubuntu services, the Docker daemons), a difference between two tools rather than an itemised measurement. One low-traffic instance, 30 August 2026.
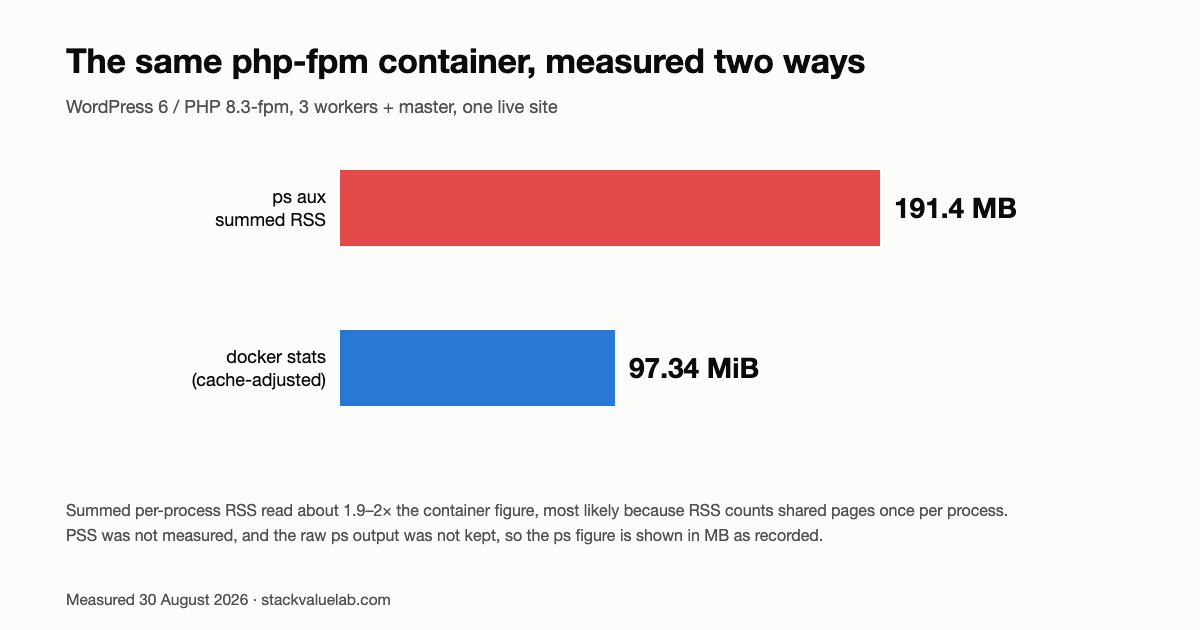
Key finding Summed per-process RSS read about 1.9–2× the container figure. Three php-fpm workers plus master summed to 191.4 (recorded as MB; the raw output was not kept) in ps aux, against 97.34 MiB for the whole container in docker stats, a cache-adjusted figure rather than the raw cgroup total. RSS counts shared pages once per process, which most likely explains most of the gap (PSS was not measured), so a pm.max_children formula fed a summed RSS number can inherit that over-count.
Updated 13 October 2026. This page’s summary box still called the docker stats figure the container’s cgroup total, and one sentence called it the container’s actual memory usage; it is the cache-adjusted figure described below, and both now say so. The 2× comparison is now given in both possible units (1.88–1.97×, because the raw ps output was not kept). The explanations for the gap and for the memory outside the containers, here and in the closing summary, are marked as interpretations of one reading rather than separate measurements. No measurement changed.
Updated 8 September 2026. Corrected how this page labelled the docker stats column: on Linux that figure is cache-adjusted, not the raw cgroup total. Added an explicit note that these are observations from one instance rather than a requirement, and stated the MiB to MB conversion.
Our php-fpm container runs three workers and a master. ps aux reports them at 59.0, 58.7, 57.3 and 17.4 MB. That is 191.4 MB in total. docker stats reports the whole container at 97.34 MiB, a cache-adjusted working set rather than the raw cgroup total.
Both readings are correct for what they measure. The first one counts shared memory more than once.
KEY FINDING: on this instance, the summed per-process RSS of php-fpm was about 1.9–2× what docker stats reported for the whole container, most likely because RSS counts a shared page once for every process that maps it (we did not measure PSS, and the docker stats figure also leaves out inactive file cache, which may account for part of the gap). Sizing by a per-worker RSS figure multiplied by the worker count can overstate that component by a similar margin; how much depends on how much of each worker is shared on your machine.
What this page is and is not. These are readings from one low-traffic instance on one day, not a minimum requirement and not a recommendation. A site with plugins we do not run, traffic we do not have, or a different PHP worker count will read differently. Treat the numbers as a worked example of how to measure your own machine, and the sizing advice further down as a separate judgement that we label where we make it. The docker stats and free figures are binary (MiB): 262 MiB is 274.7 MB. The ps figures are shown in MB as recorded; whether those were binary or decimal is not known, because the raw output was not kept (see “Where the 2× comes from”).
Two more numbers from the same machine: the whole WordPress stack (web server, PHP and database) uses 262 MiB, and the memory in use outside those containers comes to 491 MiB: roughly the kernel, Ubuntu’s services and the container runtime, taken as the difference between two tools rather than itemised. That is 1.9× the application.
Measured 30 August 2026, 27 hours after container start.
What the existing guides answer, and where they stop
We read the first page of results for how much RAM does WordPress need. Most of it is recommendation writing from companies that sell hosting. SSD Nodes is representative: 512 MB to 1 GB per site, while stating plainly that “WordPress RAM requirements aren’t officially published.”
One is not like the others. HelpWithWeb publishes real measurements and says how it got them: ps aux RSS readings on live PHP 8.1–8.3 sites with 15 to 40 plugins, under real traffic:
| Site type | Per php-fpm worker |
|---|---|
| Plain blog, light plugins | 40–70 MB |
| Business site with a page builder | 80–130 MB |
| WooCommerce / membership | 100–200 MB |
That is a good measurement of a worker, taken under load across many sites, and this page does not improve on it. Our own ps readings land in the same range: 57–59 MB per worker for a plain blog.
The problem is what happens next. A per-worker figure is only useful if you multiply it by your worker count, and that multiplication is where sizing goes wrong, for a reason that has nothing to do with the measurement being wrong.
What is running
| Component | Image |
|---|---|
| Web server / TLS | caddy:2-alpine |
| WordPress | wordpress:6-php8.3-fpm-alpine |
| Database | mariadb:11 |
Host: Amazon Lightsail, $12/month: 2 GB RAM, 2 vCPU, 60 GB SSD, 3 TB transfer (official pricing). Ubuntu, Docker Compose, eleven published articles, near-zero traffic.
That last part matters, and we come back to it.
Measured memory, per container
docker stats --no-stream. One correction to how this page first labelled the column. On Linux the Docker CLI does not print the raw cgroup total: its own documentation says it “reports memory usage by subtracting cache usage from the total memory usage”, where cache is the inactive_file field on cgroup v2. The API returns the unadjusted total and the cache separately, so a client can choose. The figures below are therefore a cache-adjusted working set, which is the number you want when sizing a server, but it is not what memory.current would show you.
| Container | Using | Cap set | % of cap |
|---|---|---|---|
| Caddy | 44.97 MiB | 96 MiB | 46.9% |
| WordPress (php-fpm) | 97.34 MiB | 320 MiB | 30.4% |
| MariaDB | 119.6 MiB | 384 MiB | 31.1% |
| Total | 261.9 MiB | 800 MiB | 32.7% |
Memory caps are set on each container. Every one is well under its cap, so the caps are not suppressing these numbers. The database is the largest single consumer, and it is the one that grows.
Where the 2× comes from
ps aux on the same machine, php-fpm processes only:
| Process | RSS |
|---|---|
| worker | 59.0 MB |
| worker | 58.7 MB |
| worker | 57.3 MB |
| master | 17.4 MB |
| Sum | 191.4 MB |
The container is using 97.34 MiB. ps reports RSS in kilobytes and the figures above are that value converted; read as MiB (kilobytes divided by 1,024) the sum is 1.97× the container figure, and read as decimal megabytes it is 1.88×. We did not keep the raw ps output, so both are stated: about 1.9–2×.
Nothing is wrong with either tool. RSS is resident set size per process, and it includes shared pages in full for every process that maps them. php-fpm workers are forked from the master: the PHP binary, every loaded extension, the opcache, and any memory the master touched before forking are one physical copy that all four processes report as theirs. ps counts that copy four times. The cgroup accounting behind docker stats counts each physical page once, which is much closer to the RAM you actually have to buy (on Linux the CLI also subtracts inactive file cache from it).
That explanation fits the gap, but it is an interpretation: we did not measure PSS, so how much of each worker’s RSS is shared on our machine is not established here. There is a second, unmeasured contributor: RSS includes file-backed pages such as the PHP binary and shared libraries, while the docker stats figure leaves out inactive file cache, so part of the gap may come from that difference in counting.
What this does to your pm.max_children
The php-fpm tuning guides we read give the same formula:
pm.max_children = available RAM / average process sizeThe formula is fine. In the guides we read, the input is an RSS reading, and summed RSS counts shared pages more than once. That error propagates in both directions depending on which side you solve for:
- Sizing a server for a fixed worker count. Ten workers at a 60 MB RSS reading looks like 600 MB. If half of each worker’s RSS were shared, the real figure would be closer to 300 MB, and you would buy up to twice the RAM.
- Setting max_children for a fixed server. The same inflation makes each worker look expensive, so you cap concurrency lower than the machine can actually support, and requests queue on a box with free memory.
The fix is to measure the process group rather than a process. Three ways, all of which count shared pages once:
# containers
docker stats --no-stream

# systemd services, no containers
systemd-cgtop
cat /sys/fs/cgroup/<slice>/memory.current

# per-process, shared pages split proportionally
smem -k -P php-fpm      # read the PSS column, not RSS
PSS, proportional set size, divides each shared page by the number of processes mapping it. Summing PSS across a process group gives a total you can trust; summing RSS does not.
We did not measure the marginal cost of one additional worker, which is what you would want to plug into the formula. That needs readings at two different worker counts, and we have one. “Half is shared” in the example above is an assumption for the arithmetic, not a measurement of our box and not a constant.
The whole machine
free -m, same moment:
| MiB | |
|---|---|
| Total | 1,906 |
| Used | 753 |
| Buffers / cache | 1,109 |
| Available | 1,152 |
Used is 753 MiB. The containers account for 262 MiB of it in docker stats. The other 491 MiB is, roughly, everything outside the three containers: the kernel, Ubuntu’s services and the container runtime. It is a difference between two tools that count cache differently (free and docker stats), not an itemised measurement. The named processes, by RSS:
| Process | RSS |
|---|---|
dockerd |
67.2 MB |
systemd-journald |
48.8 MB |
containerd |
38.2 MB |
fwupd |
26.6 MB |
multipathd |
26.0 MB |
snapd |
20.0 MB |
networkd-dispatcher |
18.1 MB |
unattended-upgrade |
14.0 MB |
(These are RSS figures and carry the same inflation described above, so treat each as an upper bound.)
Docker’s own daemons, dockerd plus containerd, read 105 MB of RSS, an upper bound. That is roughly 40% of what the entire WordPress stack uses. You are paying it for isolation and reproducibility, which may well be worth it. It is simply not free, and none of the sizing guides we read counts it.
Three more entries (fwupd, multipathd, snapd) total 72.6 MB and handle firmware updates, multipath storage and snap packages. A single-purpose web server does not obviously need any of them.
| MiB | % of total (1,906 MiB) | |
|---|---|---|
| Outside the containers (OS, services, runtime) | 491 | 25.8% |
| WordPress stack | 262 | 13.7% |
| Available | 1,152 | 60.4% |
On this machine, most of the memory in use sat outside the WordPress containers. The advice that says “get 2 GB” is not wrong about the box. It is pointed at the smaller half of the bill.
This also dissolves a contradiction people run into: the measurements are small, the hosting advice is large, and both are correct. They describe different things, and much of the gap between them is everything outside the application.
What this implies for a 1 GB plan
Lightsail’s 1 GB tier is the cheapest step down. Our measured total at idle is 753 MiB, and we have no measurement showing that the share outside the containers would shrink on a smaller instance. On 1 GB, after the kernel’s own reservation, that is roughly 79% of memory used before a single visitor arrives (taking about 953 MiB as usable, the same share of nominal memory our 2 GB instance reports: 1,906 of 2,048 MiB).
That is arithmetic on our numbers, not an experiment. We have not run this stack on 1 GB and we are not going to tell you it works. HelpWithWeb’s decision table says 1 GB is fine for a small blog with proper caching, and caching is precisely what stops workers from multiplying.
Two vCPUs, doing nothing
Load average over 1, 5 and 15 minutes:
load average: 0.00, 0.02, 0.00Per container: 0.00%, 0.01%, 0.01%. Swap is 2 GB configured and 30 MB used, 1.5%. The machine has never been under memory pressure.
For a content site this size, vCPU is the specification you are least likely to need and the one every plan raises alongside RAM. Our price-per-GB-of-RAM comparison shows how tightly providers bundle the two.
A disk line item to plan for
docker system df:
| Type | Size | Reclaimable |
|---|---|---|
| Images | 1.75 GB | 405 MB (23%) |
| Build cache | 896.6 MB | 450.4 MB |
| Local volumes | 309.1 MB | 0 B |
| Containers | 57.34 kB | 0 B |
Build cache is 897 MB, half the size of every image on the machine, and nearly three times the site’s actual data.
Disk in use is 10 GB of 58 GB, so it is not urgent here. On a 40 GB plan with a few rebuilds behind you it stops being a footnote. docker builder prune reclaims 450 MB.
The site’s real data (WordPress files, the database, TLS certificates) is the 309 MB of volumes. Everything else is machinery.
WP_MEMORY_LIMIT is not your memory usage
Our config sets:
define('WP_MEMORY_LIMIT', '256M');This gets read as “the site needs 256 MB” far more often than it should. It is a per-PHP-process ceiling: the most any single request may allocate before PHP kills it. It is not an allocation, not a reservation, and not a measurement.
The entire php-fpm container, master and workers together, is using 97 MiB. The 256 MB limit has never been approached.
Raising it does not make your site use more memory and does not require a bigger server. It changes when a runaway request fails.
Someone else can own this machinery for you. We turned that premium into an hourly rate for your own time.
Method and limits
What we measured. One site, one configuration, 30 August 2026, 27 hours after container start. docker stats --no-stream for per-container memory, which on Linux is the cgroup total minus inactive_file cache rather than the raw total; ps aux --sort=-rss for per-process RSS; free -m and /proc/meminfo for the host; docker system df for disk; uptime for load. Instance specification confirmed against AWS’s published pricing page. We opened two of the nine first-page results to check their method and did not read all nine in full, so statements about what is unpublished describe our search, not a proof of absence.
The server runs nothing else. We checked, because the instance is named for an earlier project. The only Python processes are networkd-dispatcher and unattended-upgrade, both Ubuntu defaults. Nothing else competes for the 491 MiB.
Traffic. This site gets almost no traffic, and that single fact limits everything above. php-fpm allocates per concurrent request; the container grows with pm.max_children and with how many visitors arrive at once. MariaDB’s InnoDB buffer pool grows with the working set. 262 MiB is a floor for this stack, not a ceiling. For behaviour under load, the per-worker figures cited above are the better source.
Uptime. 27 hours. MariaDB’s memory rises over days as the buffer pool fills. Even the idle number is probably not final.
One configuration. Alpine images, php-fpm rather than Apache with mod_php, no object cache, no page-cache plugin, eleven articles, one theme. Any of those changes the number, and mod_php in particular is heavier.
We did not test 1 GB, and we did not measure the marginal cost of an additional worker. Both of those sections are arithmetic on 2 GB measurements.
What we can say is narrow: on this running WordPress site, summed RSS for php-fpm read about 1.9–2× the container’s own figure, and more memory was in use outside the WordPress containers than inside them (a difference between free and docker stats, not an itemised measurement). If either holds on your machine too, the sizing question has been aimed at the wrong number.
Related
- What a GB of RAM Actually Costs: Every Major VPS Provider
- Four Things That Broke in Three Days of Self-Hosting WordPress on Docker and Caddy
- Cloudways vs Kinsta: What Each Plan Actually Costs in 2026, if you would rather pay a managed host than size the server yourself
- Managed hosting cost calculator, to price a reseller, a control panel or a fixed-price host at your own server size
Sources
- Amazon Lightsail pricing, instance specification and monthly price
- HelpWithWeb: How Much RAM Does a WordPress Site Actually Need?, per-worker RSS measurements under real traffic
- SSD Nodes: How Much RAM Does My VPS Need?, representative recommendation guidance
- Docker:
docker stats, reports cache-adjusted cgroup memory on Linux, not summed RSS - Docker:
docker system df - WordPress:
WP_MEMORY_LIMIT
This page links to each vendor’s own pricing page. No affiliate links are used at this time.